

Every October 1, HUD’s fiscal year turns over, and with it the reference points that decide how a Section 8 property is measured against its market. This year the turnover moved more than one number, and it moved them unevenly. For an owner planning a Section 8 contract renewal or weighing a sale in the next eighteen months, the useful question isn’t the aggregate. It’s which of those numbers apply to a specific property, and on what schedule.
The market baseline
HUD’s FY2027 Fair Market Rents and Small Area Fair Market Rents took effect October 1, following publication in the Federal Register on September 1. Last month we looked at why the national benchmark runs about two years behind the market. This month the question is narrower: within a single metro, how far apart can the numbers be?
The two figures do different jobs. The FMR is one number for an entire metro area. The SAFMR divides that area into ZIP codes, each with its own rent. Chapter 9 of the Section 8 Renewal Policy Guide uses SAFMRs as reference points for rent comparability. In our covered markets, they compare like this:
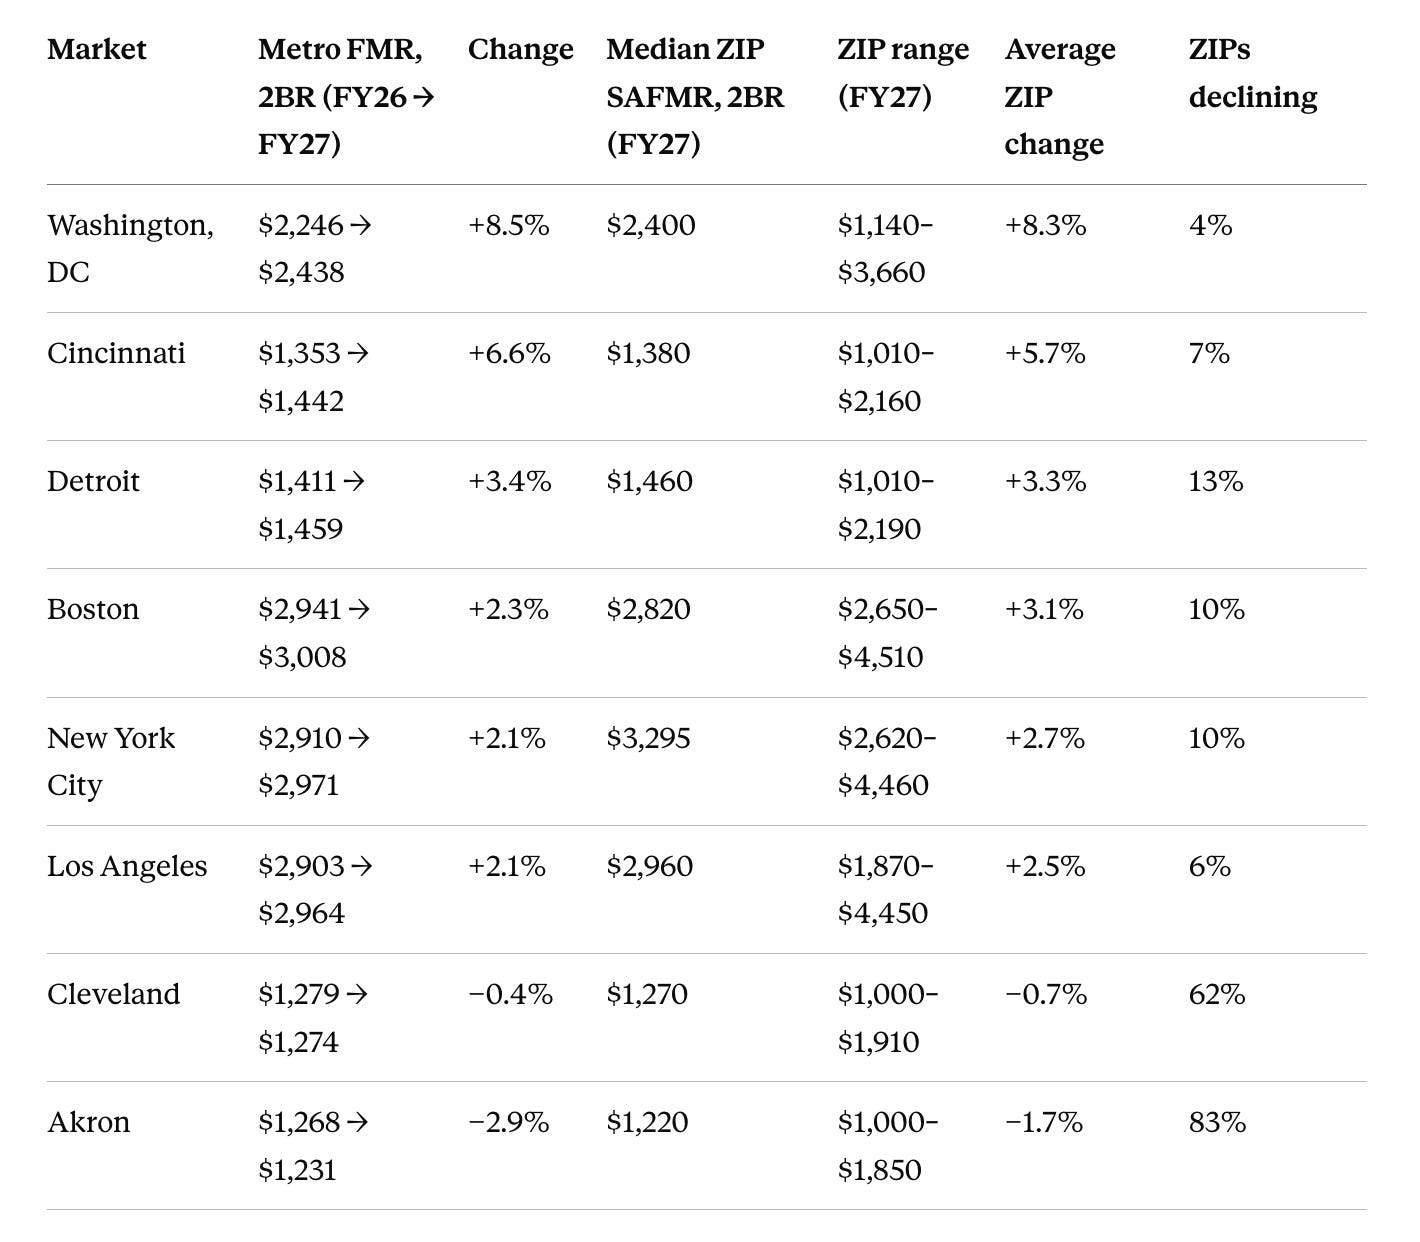
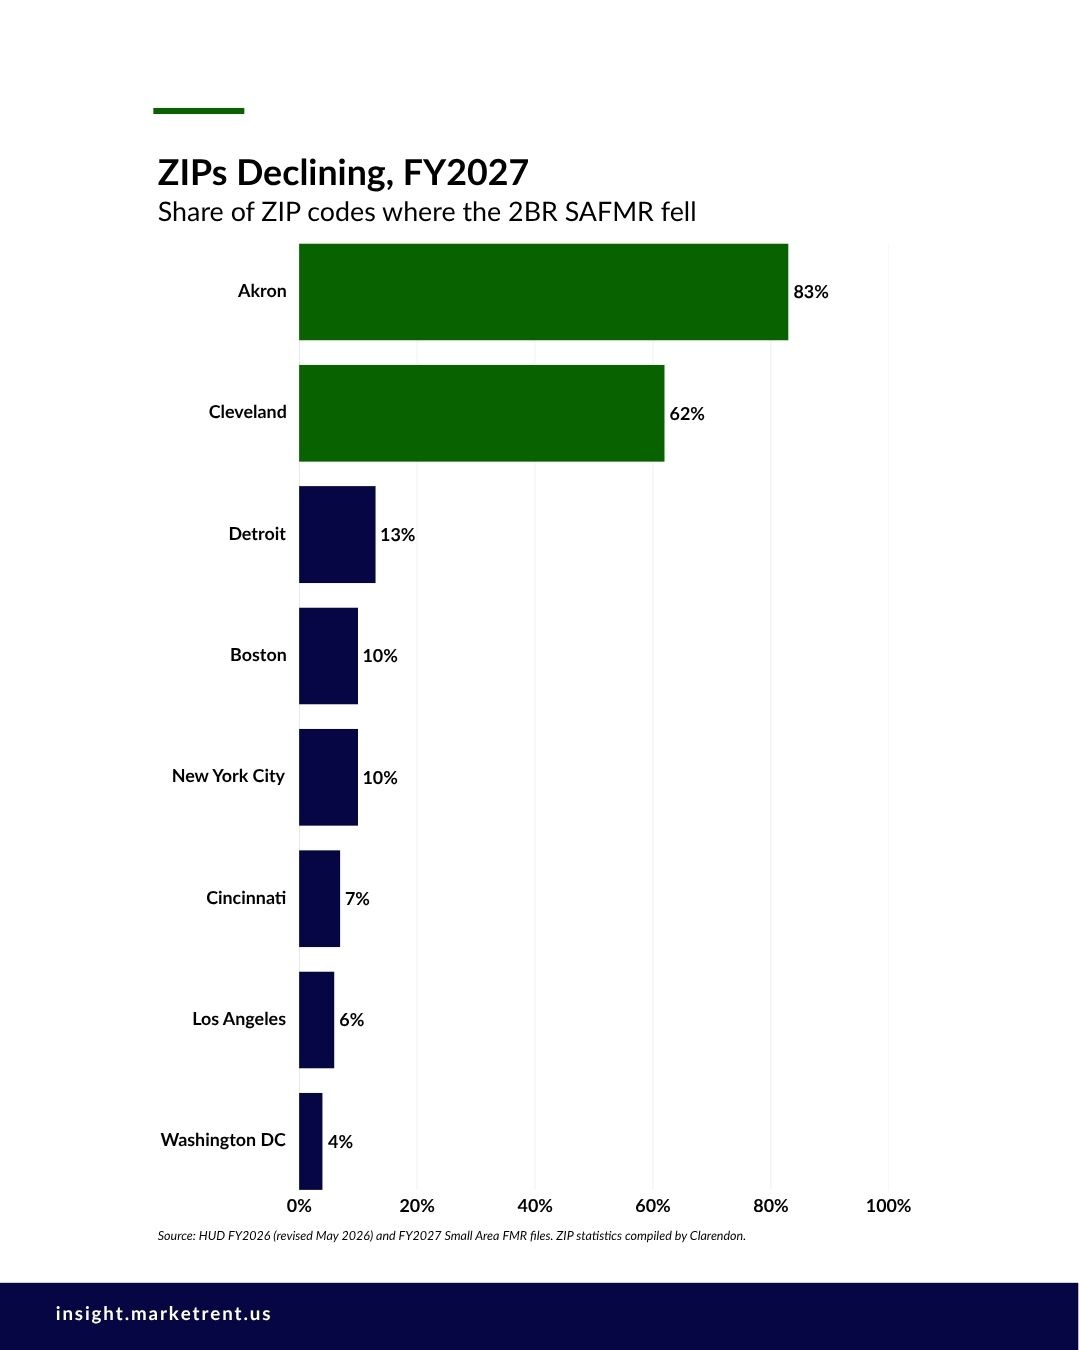
In most of these markets the metro figure and the typical ZIP moved together. What differs is how many ZIP codes went the other way. Cleveland’s metro number barely moved, yet six in ten of its ZIP codes declined; in Akron, more than eight in ten did. Washington’s typical ZIP rose about 8 percent, but its range runs from $1,140 to $3,660, and one ZIP code rose 48 percent. In Boston, the median ZIP sits about $190 below the metro figure. An owner benchmarking against the metro number there would be using a figure above what most of the metro’s ZIP codes carry.
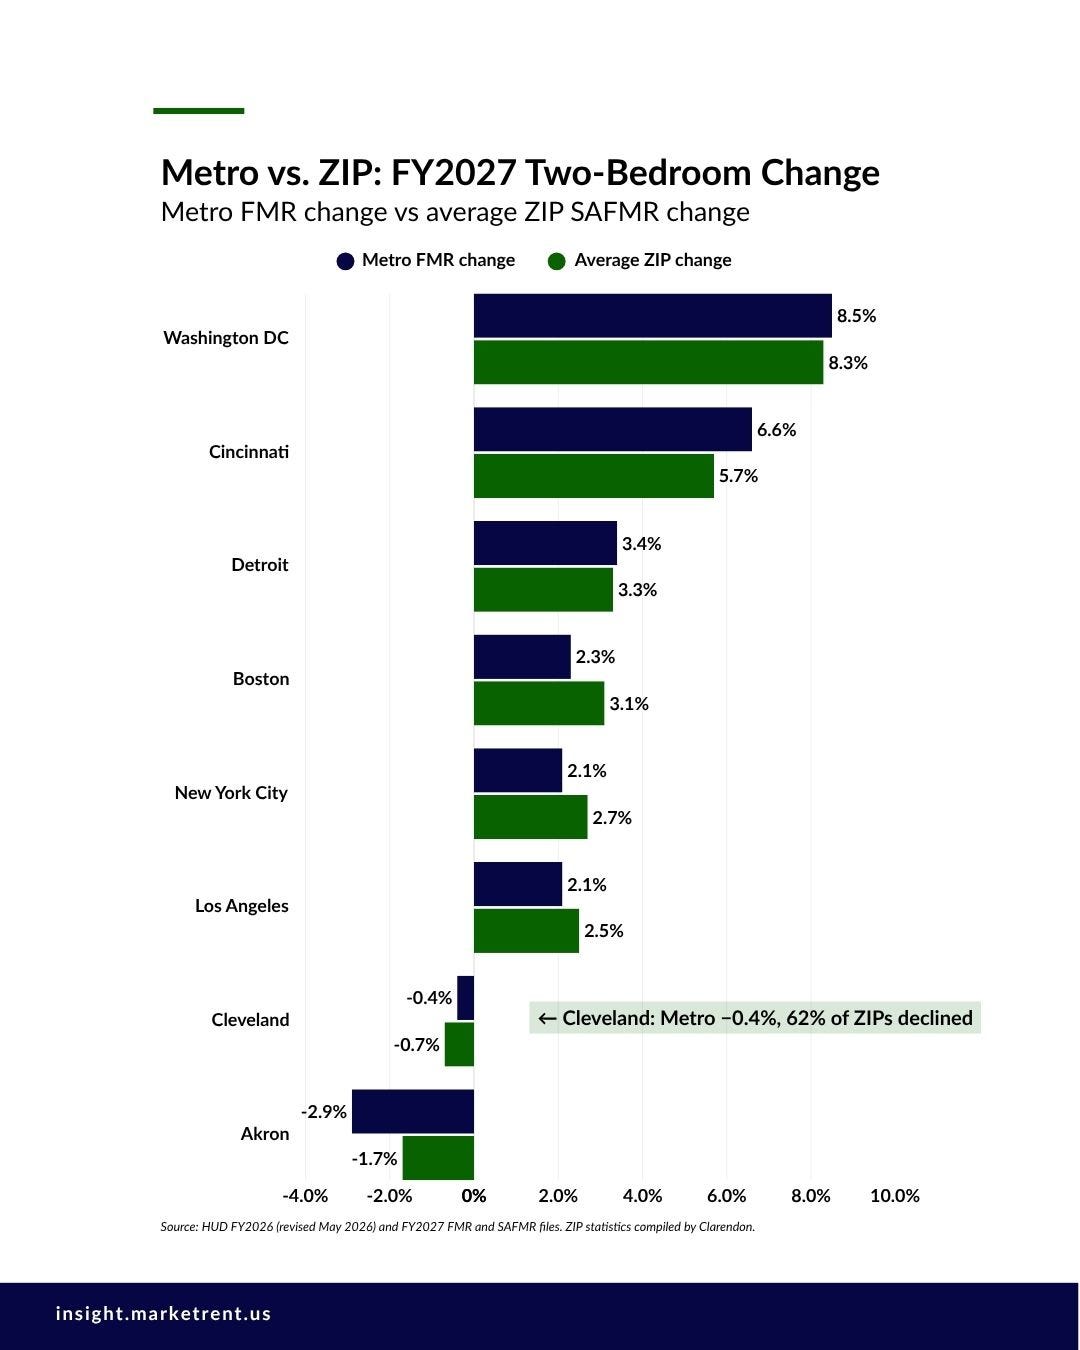
Cleveland has been a mandatory SAFMR area since HUD’s 2023 designation took effect in October 2024, so for voucher payment standards there, the ZIP figure is the one that applies. A flat metro number can sit on top of real movement from one neighborhood to the next. We walked through that pattern across four markets last spring, and it holds again this year.
HUD made one methodology change for FY2027, which it proposed in last year’s notice and adopted as proposed. The Bureau of Labor Statistics discontinued its local housing fuels and utilities price index. In its place, HUD now uses a composite of state-level Energy Information Administration prices for electricity, natural gas and fuel oil, plus national water, sewer and trash costs. The SAFMR methodology itself is unchanged.
Why should a project-based owner care about voucher benchmarks? There are three reasons:
HUD uses FMRs to set initial renewal rents for some expiring contracts.
Chapter 9 ties two thresholds to SAFMRs. Some Option Two renewals can use 90 percent of the SAFMR instead of a full HUD Rent Comparability Study, and HUD commissions its own study when a project’s gross rent exceeds 150 percent of the SAFMR. Both now rest on a new set of ZIP-level numbers. Our SAFMR calculator shows where any ZIP sits against that line.
For investors, SAFMRs set the payment standards that voucher holders bring to the non-PBRA units in a building.
What didn't move: OCAF
Operating Cost Adjustment Factors did not change on October 1. They run on contract anniversaries. The 2026 factors (5.1 percent nationally; Ohio 4.9, Massachusetts 4.8, New York and Pennsylvania 4.7, Michigan 4.4, Connecticut 4.3) apply to anniversaries on or after February 11, 2026. HUD has not yet published the 2027 factors. Last year’s arrived on February 3, eight days before they took effect.
OCAF adjusts rents; it doesn’t test them against the market. As we noted this summer, over a five-year cycle the two can drift apart in either direction. The rent comparability study is where market alignment is recovered.
What's pending: FY2027 funding
FY2027 opened without full-year appropriations. A continuing resolution funds the government through December 11, 2026, and Congress is in recess until November 9. A continuing resolution generally carries prior-year funding forward. FY2026 provided $18.543 billion for Project-Based Rental Assistance, so the reasonable expectation is that HAP payments continue on schedule under the current resolution.
What started: NSPIRE scoring
October 1 also changed what the inspection process counts. Under Notice PIH 2025-27, HUD began scoring NSPIRE’s new affirmative requirements on October 1, 2026. These cover fire-labeled doors, GFCI and AFCI protection, guardrails, HVAC, and interior and minimum electrical lighting. Full HOTMA compliance for Multifamily owners follows on January 1, 2027. Neither changes a rent. Both change what a buyer’s diligence team reads when it opens the file.
What it adds up to
The five-year RCS cycle, the OCAF anniversary and a disposition timeline rarely line up on their own. This October delivered four things:
a new SAFMR baseline
a pending OCAF
a funding date in December
inspection scoring that now counts more items
The opportunity is in sequencing. A phased RCS approach starts with a preliminary rent assessment against the FY2027 SAFMRs. That shows whether a below-market Section 8 rent can be brought into market alignment before renewal, and before a buyer underwrites the in-place rent as a ceiling. For properties that offer services, non-shelter services valuation belongs in the same conversation.
October 1 doesn’t tell an owner what a property is worth. It tells them what HUD will measure against for the next twelve months. Knowing that measure early, ZIP code by ZIP code, is most of the advantage.
Eve Moss is the founder of Clarendon and editor of MarketRent™. Next week: the national Q3 issue, with September rent and occupancy data.
More on SAFMRs
Pulse — What We’re Tracking
The Fed raises rates for the first time since 2023 — The FOMC voted 12–0 to raise the federal funds target range by a quarter point, to 3-3/4 to 4 percent, citing inflation that remains elevated. The median projection points to one more increase by year-end. For owners planning a disposition, buyers will price debt into their bids, which makes setting rents to the market early more valuable.
Rents enter the off-season, with annual growth firming — Apartment List reports the national median rent slipped 0.1 percent in September, its first monthly decline since January. Rents are still slightly below a year ago, but year-over-year growth is inching up and vacancy is easing. Yardi Matrix puts annual asking-rent growth at 0.7 percent. Two trusted sources give two readings for the same month. Any national figure is a starting point; the comparables that set a property’s rents sit several layers below it.
ROAD to Housing Act implementation begins — HUD and USDA signed a memorandum of understanding, required by the new law, to streamline environmental reviews for housing they fund. The agencies will also evaluate whether a joint physical inspection process is feasible for projects both oversee. It’s the first concrete implementation step since July, and owners of properties with dual HUD and USDA exposure should watch the inspection piece now that NSPIRE scoring has expanded.
Also Tracking
HUD launches a factory-built multifamily initiative — HUD selected the National Institute of Building Sciences for a 12-month effort to develop a performance-based framework for factory-built housing in developments of five or more units. It does not change current federal requirements.
Midwest strength in single-family rentals — Cleveland ranks among the leading markets for year-over-year built-for-rent single-family rent growth, alongside Miami, Kansas City and Chicago.
The FY2027 data is live on marketrent.us The SAFMR heat map covers every ZIP code by bedroom count, with the change from last year. The calculator does the same for a single ZIP and marks the 150 percent threshold, using FY2027 for anything renewing on or after October 1. Both are free with a MarketRent™ account, along with the market briefs and Ask MarketRent, which answers questions against everything published here.
Archive • About • Tools • Services • Contact
About Clarendon: Clarendon is a commercial real estate advisory firm specializing in affordable and multifamily housing — providing brokerage, valuation, HUD Rent Comparability Studies, market studies, and appraisals for owners, investors, housing authorities and agencies nationwide.
© 2026 The Clarendon Group, Inc. All Rights Reserved. Disclosure