Mid-year 2025 presents exceptional opportunities for strategic property assessment. With Q2 market data revealing positive shifts in regional performance patterns, property owners who understand their market alignment position can make informed decisions about enhancement timing and strategic priorities.
This assessment framework helps you evaluate your property's market alignment opportunities while identifying key indicators that suggest professional HUD Rent Comparability Studies could provide strategic advantage for upcoming Section 8 contract renewals.
Market Alignment Opportunity Assessment
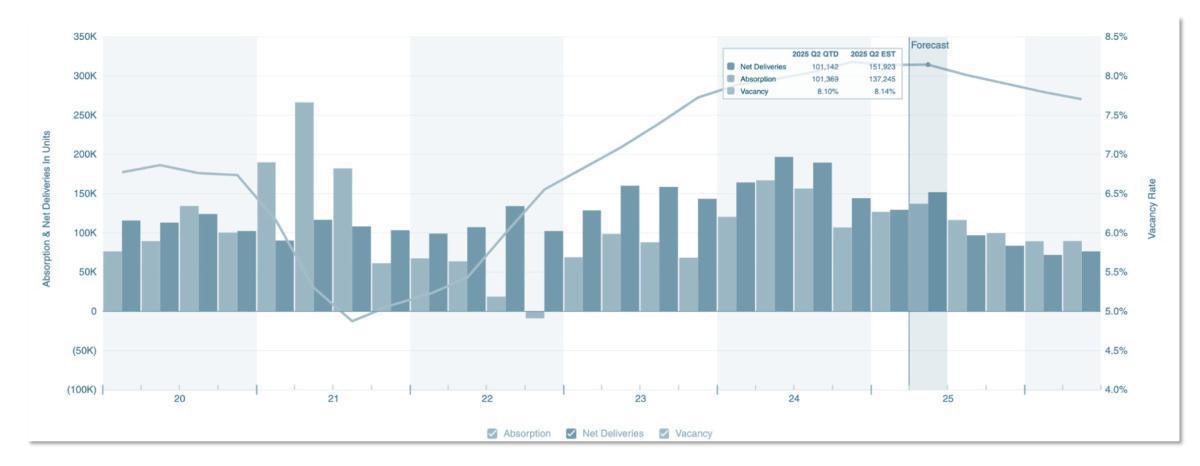
Source: CoStar Q2 2025
The Q2 2025 market intelligence reveals a strategically favorable environment for Section 8 property performance enhancement, with fundamental market conditions creating expanded opportunities for properties seeking to achieve optimal market alignment.
Current market fundamentals strongly support strategic market alignment initiatives. Q2 2025 data from CoStar shows absorption outpacing deliveries nationwide, with developers' reduced pipeline creating a 40% decline in expected 2025 deliveries. This supply-constrained environment typically supports rent growth opportunities and creates favorable conditions for properties pursuing market alignment through professional HUD Rent Comparability Studies
Regional Market Performance Indicators
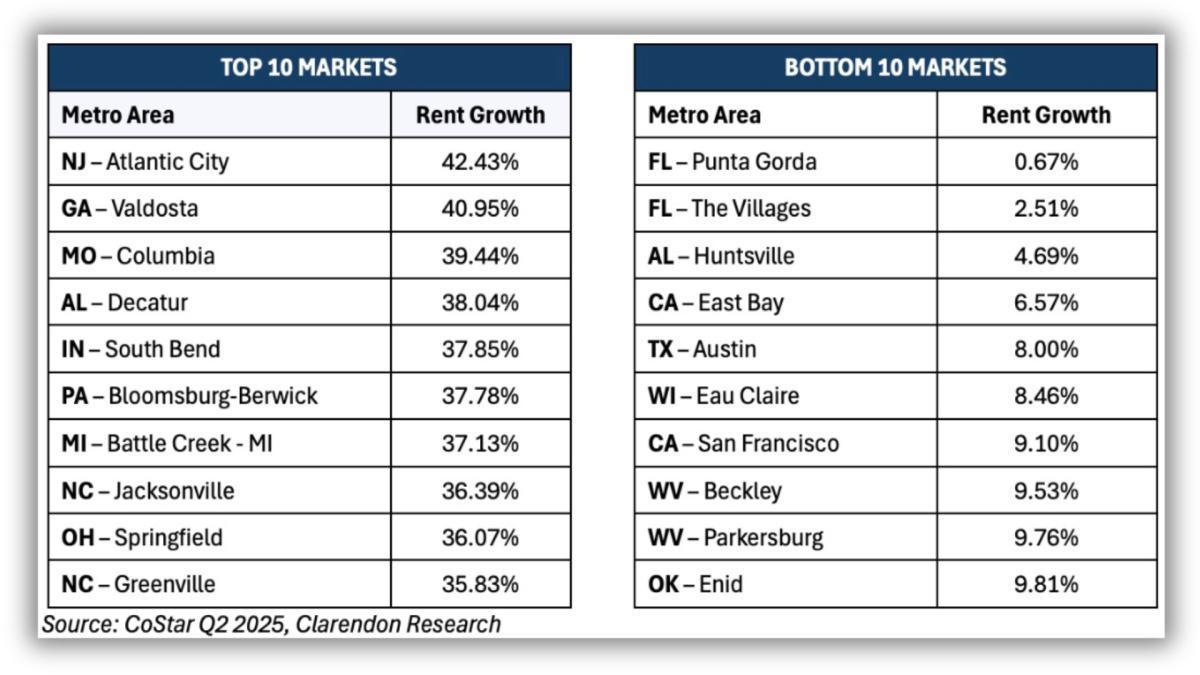
Source: CoStar Q2 2025, Clarendon Research
Market Performance Variation Analysis
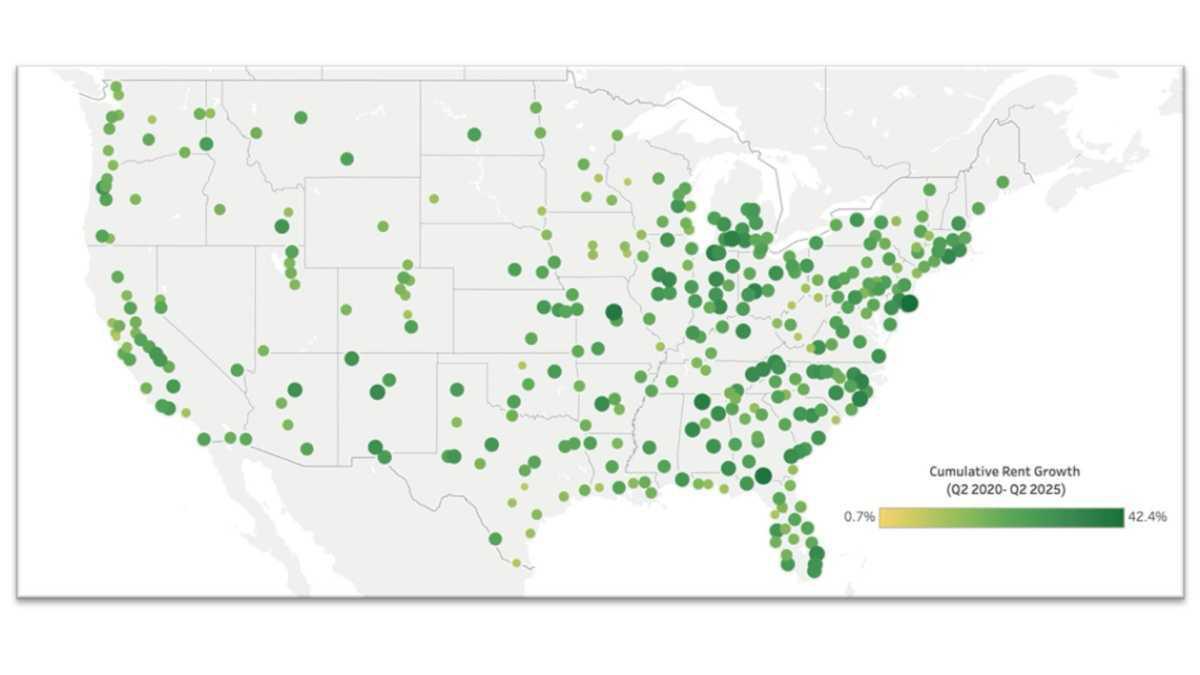
Analysis of rent growth patterns during the past 5 years (2020-2025) across 390 metropolitan markets reveals significant variation in property performance opportunities. Our comprehensive market intelligence, derived from CoStar data and analyzed through Q2 2025, demonstrates how markets vary dramatically by geography, with cumulative growth ranging from 0.7% to 42.4% at the metropolitan level – we find even wider ranges at the neighborhood or submarket level.
Market Size and Geographic Patterns
The data reveals distinct patterns that inform strategic positioning decisions. Smaller metropolitan markets dominate the highest growth tier, with Atlantic City, NJ leading at 42.4%, while several major coastal markets appear among the lowest performers. The Southeast and Midwest regions show particularly strong representation in top performers, while high-cost coastal markets demonstrate more constrained growth patterns.
Critical Context: Beyond Metropolitan Averages
While metropolitan-level data provides valuable context, Section 8 property owners must recognize that these broad averages mask substantial variation within markets. Individual neighborhoods, submarkets, and property classes often experience dramatically different performance patterns based on:
- Submarket Dynamics: Specific neighborhoods may significantly outperform or underperform metropolitan averages
- Property Class Variations: Class A, B, and C properties within the same market demonstrate distinct rent growth trajectories
- Development Quality Impact: Properties with superior maintenance, amenities, and management often achieve premium positioning regardless of broader market trends
- Non-Shelter Services Premium: Properties providing documented services (security, transportation, resident programming) can command rent premiums that exceed metropolitan growth patterns
Understanding these performance patterns enables property owners to assess their market positioning opportunities within the broader competitive landscape. Properties in higher-growth markets may benefit from enhanced positioning strategies, while those in moderate-growth regions often discover significant opportunities through sophisticated market analysis that captures localized advantages, non-shelter services valuation, and strategic positioning that metropolitan data cannot reveal.
Strategic Implications for Section 8 Properties
This geographic variation suggests that market dynamics, regulatory environments, and supply constraints vary significantly by region and market size. However, the most critical insight for Section 8 property owners is that individual property performance depends far more on submarket positioning, property-specific factors, and professional market analysis than on broad metropolitan trends. Properties with strategic professional guidance can achieve superior positioning even in moderate-growth metropolitan markets through:
- Sophisticated submarket analysis identifying localized opportunities
- Comprehensive non-shelter services documentation and valuation
- Strategic timing aligned with neighborhood-specific market cycles
- Professional comparable selection reflecting true competitive positioning
Strategic Property Performance Enhancement Framework
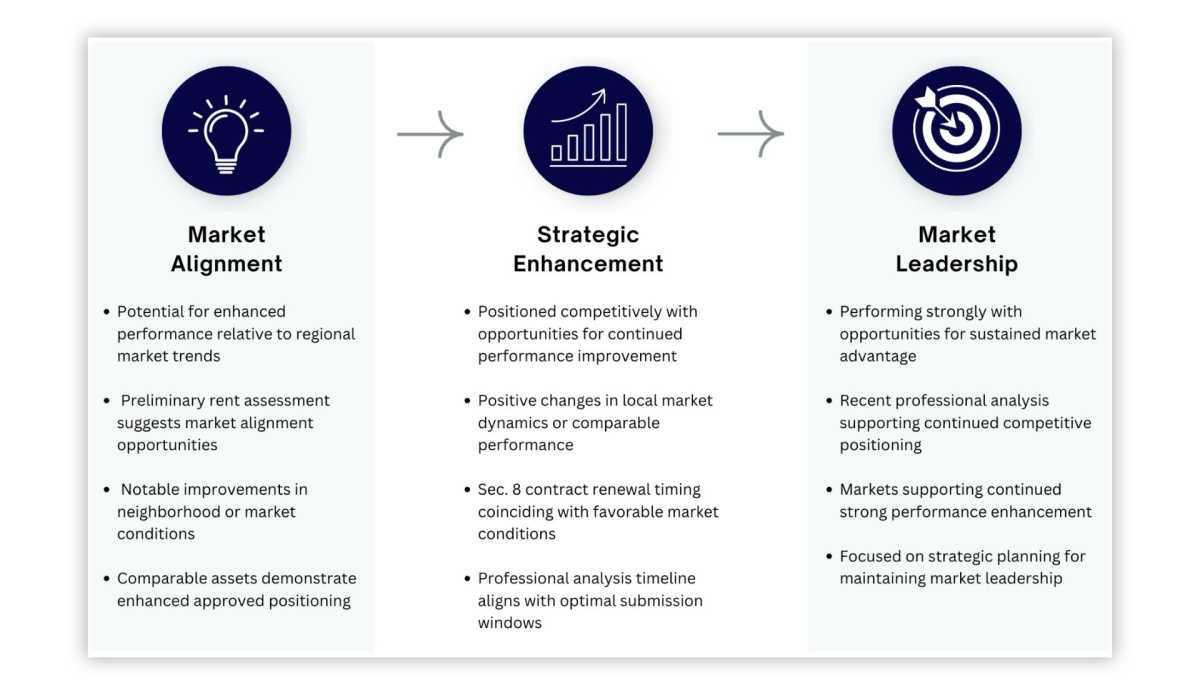
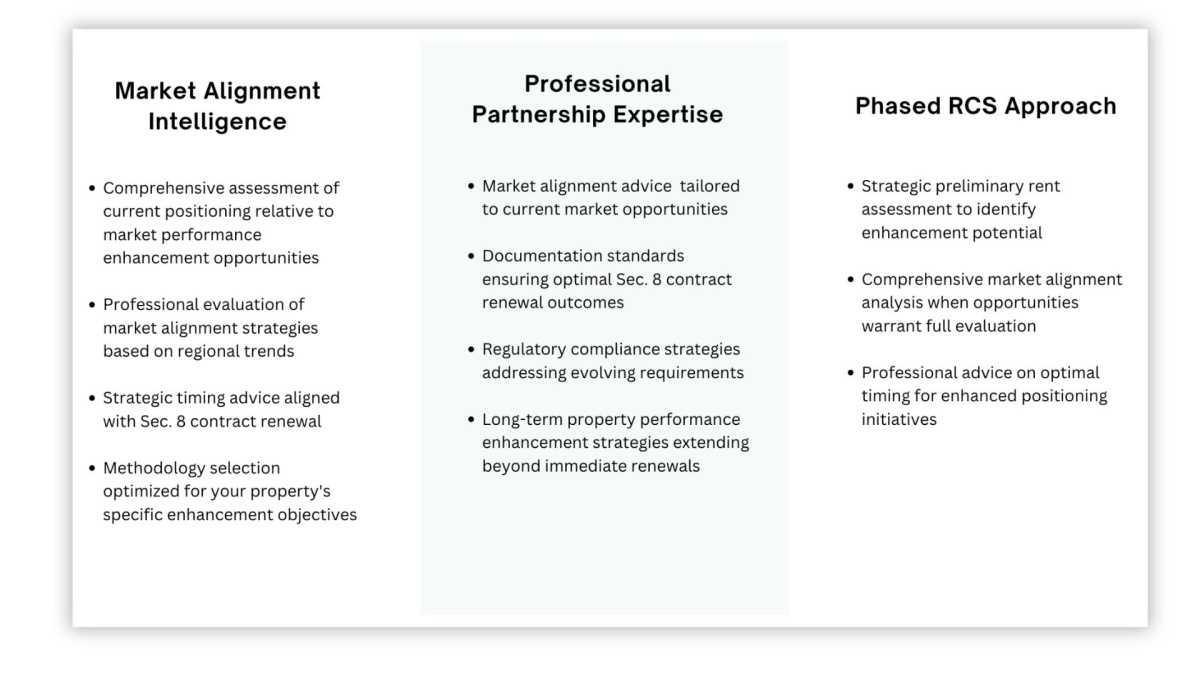
Given these market dynamics and the critical importance of submarket analysis, property owners need a systematic approach to evaluate their positioning opportunities during this optimal mid-year assessment window. Based on these market dynamics, property owners can evaluate their enhancement opportunities using this strategic framework:
Based on the framework above, properties typically fall into these enhancement opportunities:
- Market Alignment Properties:
- Current rents significantly below regional benchmarks
- Limited market analysis in past 5+ years - Undocumented services and improvements
- Strategic Enhancement Properties:
- Competitive positioning with improvement opportunities
- Some market positioning analysis completed - Favorable renewal timing alignment
- Market Leadership Properties:
- Strong current positioning with optimization potential
- Recent professional analysis supporting performance
- Focus on maintaining competitive advantage
Market Alignment Cycle Optimization
Strategic timing considerations become particularly valuable during market transition periods. Professional partnership helps optimize these opportunities while supporting sustained property performance enhancement.
Summer Market Intelligence Opportunity Period (July-September):
- Peak market activity providing comprehensive comparable data for market alignment analysis
- Professional partnership engagement during optimal information availability
- Strategic planning coordination with Q3 market cycle timing for enhanced outcomes
Pre-Renewal Strategic Enhancement Window (October-December):
- Professional documentation completion before Section 8 contract renewal deadlines
- Market alignment analysis incorporating most current available data
- Strategic positioning ready for optimal submission timing
Strategic Partnership for Market Alignment Success
Understanding when professional HUD Rent Comparability Studies provide strategic advantage requires recognizing key market alignment opportunities and timing considerations specific to your property's enhancement potential.
Mid-year 2025 market conditions create a limited-time opportunity window.
Properties that act now benefit from:
• Peak market data availability (Q2 2025 complete)
• Optimal timing for Q4/Q1 2026 renewals
• Supply-constrained market supporting enhanced positioning.
Schedule your Strategic Mid-Year Assessment before peak renewal season begins. →
Resources:


